
A practical guide to web data QA part V: Broad crawls
If you haven’t read the previous parts of our Practical guide to web data QA, here are the first part, second part, third part and fourth part of the series.
During a broad crawl, you might be extracting data from thousands or tens of thousands of websites with different layouts. When you scrape this many websites using a single spider, analyzing and validating the extracted data can be challenging. One important question to answer is what criteria should be used to determine the overall quality of the dataset.
In the following article, which is the final part of our QA series, we’re going to work with 20,000 different sites and go through all steps with detailed explanations about the process. In this example, we are interested in finding specific keywords on the sites - if the keyword is found on a page then it should be flagged for further analysis.
A large subset of heterogeneous sites should be processed to collect information for a specific keyword. We are going to crawl recursively starting from the domain and check all found links on the landing page. Several types of limits can be introduced here, like:
- Time limit - stop the spider after X hours
- Keyword matches - in case of 10 pages with the keyword, stop the spider
- Processed pages - after X processed pages complete the job for the given domain
The goal is to get as many pages as possible and verify the existence of keywords in them.
Step 1: Preparation - start with a small subset
The first step is inspired by two popular topics in programming:
Simplifying a complicated problem by breaking it down into simpler sub-problems in a recursive manner.
The idea is to identify good representations of 1-5% of the dataset and work with it. So for 20,000 sites, we can start with 200 sites that represent best the dataset. A random selection might work as well when it’s not possible to pick by other methods.
At this point, these should be clear:
- The requirements
- The edge cases if any
- What’s important and where should the focus be
Let's assume that our sites are named like this:
- site_1
- site_2
- ...
- site_n
We are going to use a semi-automated approach to verify the first n sites and the results extracted from the spider:
- Is the item coverage correct?
- Is the keyword detected correctly?
- Edge cases - javascript, rendering problems, redirects
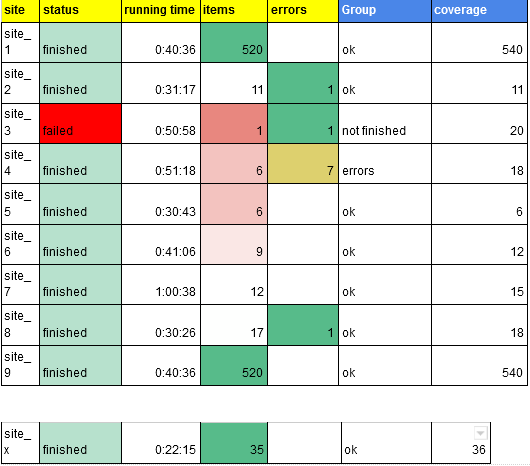
In this step, a summary of the first n spiders plus the semi-automated checks can be represented in tabular form:
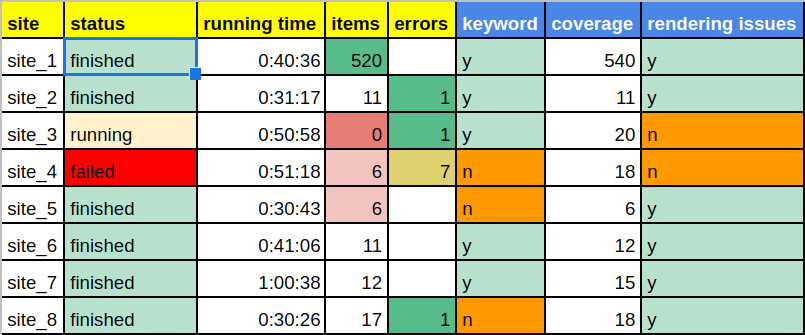
In columns with the yellow header, you can see the extraction from the spiders, while in the blue columns it’s the result from the semi-automation. If you want to learn more about semi-automation then you can read the previous blog post from our QA series.
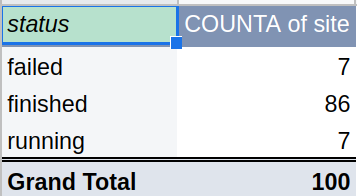
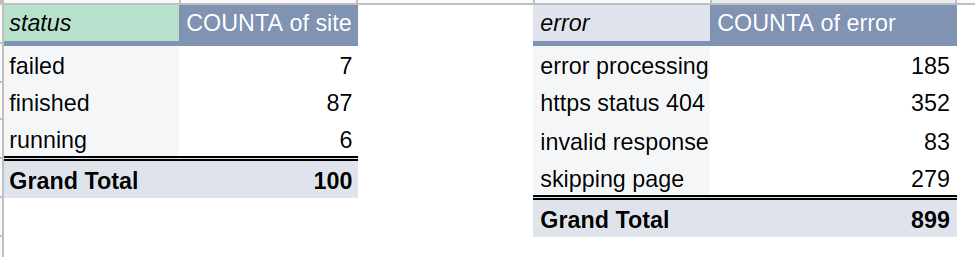
Pivot tables are handy to group results and show meaningful data for conclusions about coverage. Example for status:
The evaluation criteria for the first subset is the number of:
- failed jobs
- jobs with errors
- coverage issues
This is the high-level evaluation of the first run. In the next step, we will check how to identify potential problems.
Step 2: Identify and discuss possible problems
The remaining parts of the data validations:
- Check if items have a different URL from the domain list of the subset
- Example: site_1 has links from site_1111 - report those cases
- Check missing domains in the final results or extra domains
- If the list of the scraped sites miss any from the initial subset
- In case of redirect - site_1 redirects to site_33
- Verify the job logs and analyze them for errors, redirects, or warnings
- HTTP status codes 301, 404, 503 etc
- Analyze the keywords and the item coverage
The combination of the previous two results will be the criteria to decide if this first run is successful or not. If there are any problems, a new full run of the subset might be required (after fixes and corrections) or only on the sites which have problems.
Unexpected problems are common for broad crawls and one of the ways to deal with them is by using deductive reasoning and analysis.
Let say that for site_1 we know:
- Spider get 50 pages, and the keyword is not found
- We did a manual check and found 2000 pages with the keyword
Then we can ask several questions until we found an answer:
- Is the time limit reached?
- No - is the spider processing the site correctly?
- Yes - Why is it reached? Report.
- Errors found?
- Yes - investigate the errors and report?
- Is the keyword found?
- No - Check manually is it available on the website? Is there javascript rendering? Are all pages processed?
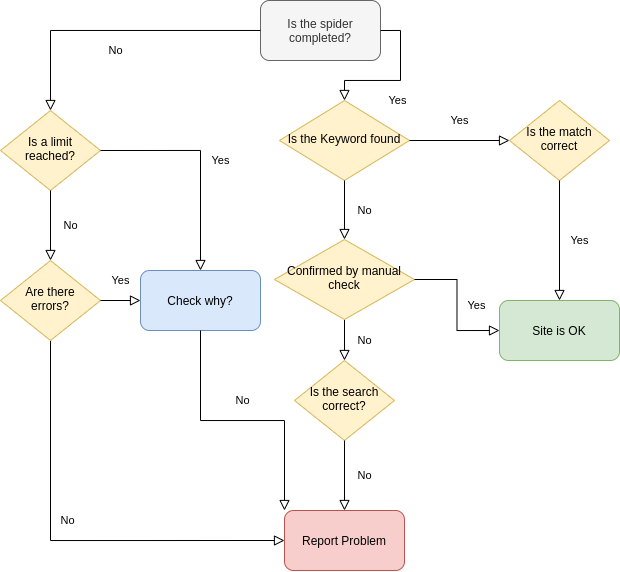
The diagram below will help whether to report a problem or mark the site as successfully crawled:
Step 3: Analyze the data
We divided the big problem into smaller tasks and defined an algorithm for successful spiders. Now we can work with the whole dataset by using tools like Pandas, Google Sheets, and our intuition.
Step 3.1: Data preprocessing
First, we recommend checking the initial source of URLs for:
- Wrong URLs - site-1.com, site-1…com, site 1.com, etc
- Duplicated sites
- Empty cells
This should be done to verify what is the expected number of processed sites - which should be something like this:
final = initial URLs - duplications - wrong URLs - empty
Checks can be done in several ways. For example, the check for duplicated data can be done in Google Sheets/Excel by using pivot tables but to do quality check we need to have in mind that data should be cleaned because:
- http://site_1.com/
- https://site_1.com/
- http://site_1.com
- http://www.site_1.com/
Will not be shown as duplicated unless we remove the extra parts like:
- https
- www
- / - ending backslash
This can be done by using:
- Formulas
- Find and replace
- Split text into columns
Pandas can be used as well:
- remove the http, https, www
df['website'] = df['website'].str.replace('http://', '')
                             .str.replace('https://', '')
                             .str.replace('www.', '')
- remove extra backslash:
# remove last / and lowercase all records
def remove_backslash(s):
    return s[:-1] if s.endswith('/') else s df_init['website'] = df_init['website'].apply(remove_backslash)
- convert all URLs to lower string:
df_init['website'] = df_init['website'].str.lower()
It’s always a good idea to compare apples with apples!
Step 3.2: Data exploration
Once data for the execution is collected n in the form of:
We can divide the jobs into several groups:
- 0 items
- many errors
- keyword found
- reached limit
Each of those groups will be analyzed for different validations. We can start with the jobs without items and investigate if:
- the site is working correctly
- are there errors in the job
- is the site reachable only for a given country
Next, let’s focus on the errors. In this case, the best is to collect logs for all jobs and process them to find top errors and after that analyze top errors one by one. Below we can find the top errors for this execution:
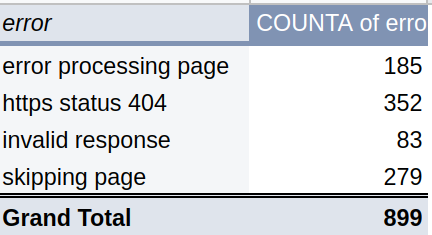
Each error should be analyzed and reported.
How to use Pandas to analyze the logs. First, we need to clean them by:
- Removing digits
- Remove extra parts that pollute the grouping like domain, page, etc - Example: [message1]: This is a message number 1...
- Shorten the log message
df['message'] = df['message'].str.split(']' , expand=True)[1] df['message_no_digits'] = df['message'].str.replace('d+', '') df['message_short'] = df['message_no_digits'] .str.slice(0, 50)
So finally we will get from
- [message1] : This is a message number 1 start spider….text...text..
- [message2] : Python error decoding 6561151 ..….text...text..
to:
- This is a message number start spider
- Python error decoding
Next we can extract URLs from the logs:
df['url'] = df['message'].str.extract(pat = '(https:.*)')
For the group with the reached limit jobs, we need to find out why this is the case. Possible reasons:
- site_1 is not accessible from location A
- site_1 is slow
- site_1 has many pages
- URLs are extracted from different domains not only from site_1
- there is a problem in the spider
All jobs in this group should have an explanation and be categorized in one of the groups above.
Let’s do the URL inspection. In this case, we can use a small and simple library like https://pypi.org/project/url-summary/
And get results like:
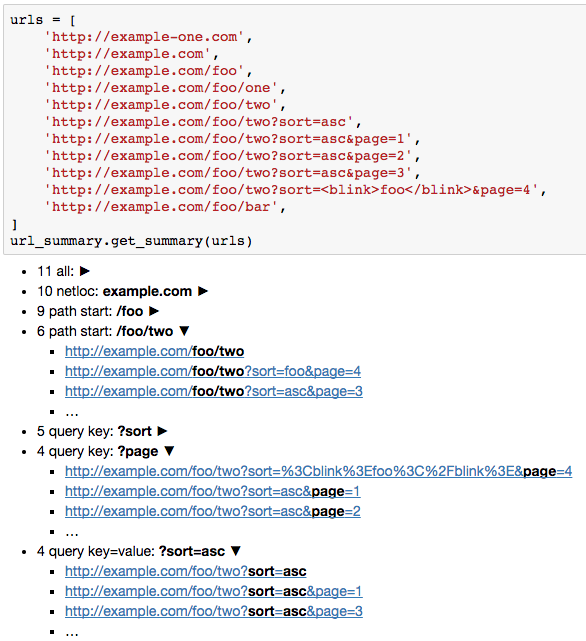
Or explore URLs by Pandas and get a summary as:
- First level
- foo - 9 times
- Second level
- bar - 1
- one - 1
- two - 7
Or do site per site analysis, counting the first level after domain:
site_1
-----------------
news 3563
services 25
site_2
-----------------
contacts 74
services 25
Below you can find part of the code used for this analysis:
url_summary.get_summary(result.url
Pandas can help too:
df['website'].str.split('/', expand=True)[3]
             .str.split('?', expand=True)[0].value_counts().head(-1)
The code above will extract everything from the 3rd / to next? and will return count for each group. Example:
Will extract - test. The output will be:
test 1
foo 1
This can be done per site with slight modifications(if the frames is a list of dataframes for each website):
for df in frames:
          print(df.iloc[0]['website'])
          print('-' * 80) print(df['website'].str.split('/', expand=True)[3]
                                             .str.split('?', expand=True)[0].value_counts().head(-1))
If data is in a single dataframe then you can use domain information if it’s exists or create it by:
df['domain'] = df['website'].str.split('/', expand=True)[0]
then you can split the DataFrame into several by:
frames = [pd.DataFrame(y) for x, y in df.groupby('domain', as_index=False)]
Or process the information by groups. The final expected result is:
site1
-----------------
test 64
foo 13
site2
-----------------
bar 3472
foo 15
tests 1
Step 3.3: Evaluation
Based on the analysis done in the previous step we can start with our evaluation. The evaluation is based on the groups above after the applied fixes and correction and re-execution of the run.
The success of the run will depend on different factors and the importance of data requirements. Pivot tables and diagrams will help:
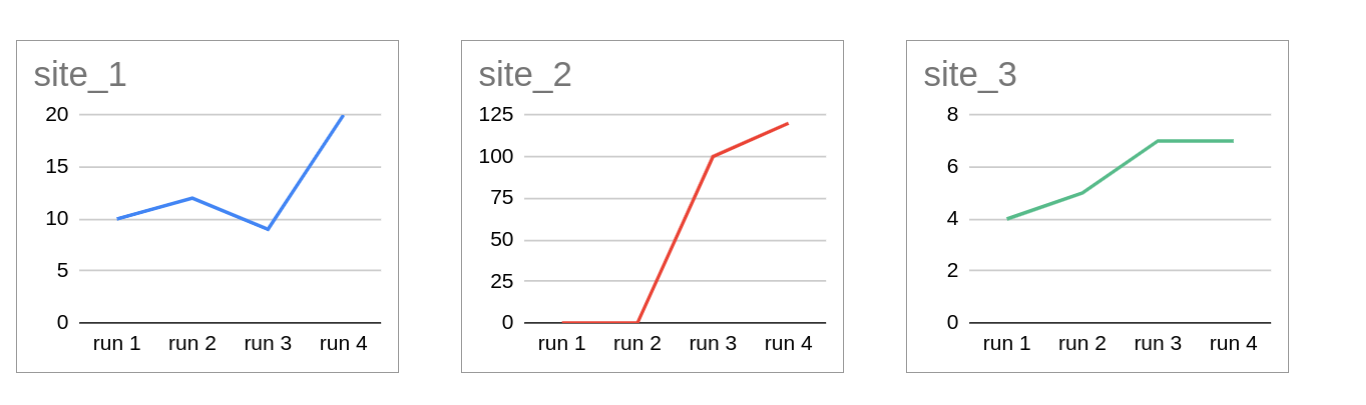
To justify the progress between the different runs and the coverage in the final one. Pandas can be used to draw plots for hundreds and thousands of rows. Drawing can be one per group or for problematic sites and factors.
Below is shown the code for plotting two plots next to each other:
import matplotlib.pyplot as plt sites = df.url.unique() for n, i in enumerate(range(0, len(sites), 2)): fig, axes = plt.subplots(nrows=1, ncols=3, figsize=(14, 6)) plt.xticks(rotation='vertical') ax1, ax2 = axes temp_df = df.copy() temp_df = df[df['url'] == sites[i]] sites_df = temp_df[['errors', 'items', 'key']].sort_values(by='key', ascending=True)[ ['errors', 'items']].fillna(0) sites_df.plot(ax=ax1, title='Plot for site ' + str(sites[i])) fig.autofmt_xdate() temp_df = df.copy() temp_df = df[df['url'] == sites[i + 1]] sites_df = temp_df[['errors', 'items', 'key']].sort_values(by='key', ascending=True)[ ['errors', 'items']].fillna(0) sites_df.plot(ax=ax2, title='Plot for site ' + str(sites[i + 1])) fig.autofmt_xdate() tempDf = df.copy() tempDf = df[df['url'] == sites[i + 2]] country_df = tempDf[['errors', 'vcard', 'items', 'key']].sort_values(by='key', ascending=True)[ ['errors', 'vcard', 'items']].fillna(0) country_df.plot(ax=ax3, title='Plot for site ' + str(sites[i + 2])) fig.autofmt_xdate() except IndexError: print('out of index')
Step 4: Reporting
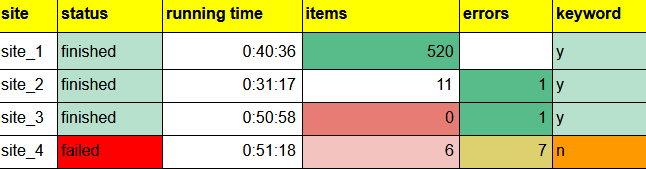
The final report will have two parts. Detailed table for all jobs from the final run:
And tab with pivot tables:
Reporting should include the most important information about the problems and should be easy to be generated.
Creating a report like the one above, when all the steps are clear, takes a few hours and a big part of the time is spent on data extraction.
Conclusions
In this article, we demonstrated how to evaluate data coming from a large number of different websites. This can be a good starting point to validate heterogeneous data and how to report the results in understandable ways for a wider audience.


_HFpro5d6k3.png&w=256&q=75)
_E4PyVpfAxa.png&w=256&q=75)


-(1).png&w=1920&q=75)
-(1)_VZGHqxCgXV.png&w=1920&q=75)
