
To some, the access control technology adoption numbers from Zyte's State of Web Access 2026 can read as stark:
- Ninety-two percent of popular sites run a web application firewall.
- Four in 10 require JavaScript rendering.
- One in five deploys a dedicated antibot engine.
If you read those figures as infrastructure requirements, the implied cost of accessing the web at scale sounds extreme.
But the cost data tells a more differentiated story.
Zyte's API classifies every site in our dataset against a five-tier model that reflects the minimum infrastructure required to access it reliably:
| Tier | Name | Infrastructure required |
|---|---|---|
| 1 | Simple | Plain HTTP - no special handling |
| 2 | Easy | JavaScript rendering (headless browser) |
| 3 | Moderate | Browser with basic fingerprint handling |
| 4 | Complex | Residential proxies or advanced evasion |
| 5 | Advanced | Full specialised infrastructure |
Mapping all 11,100 sites against that model produces a different headline than the barrier data suggests.
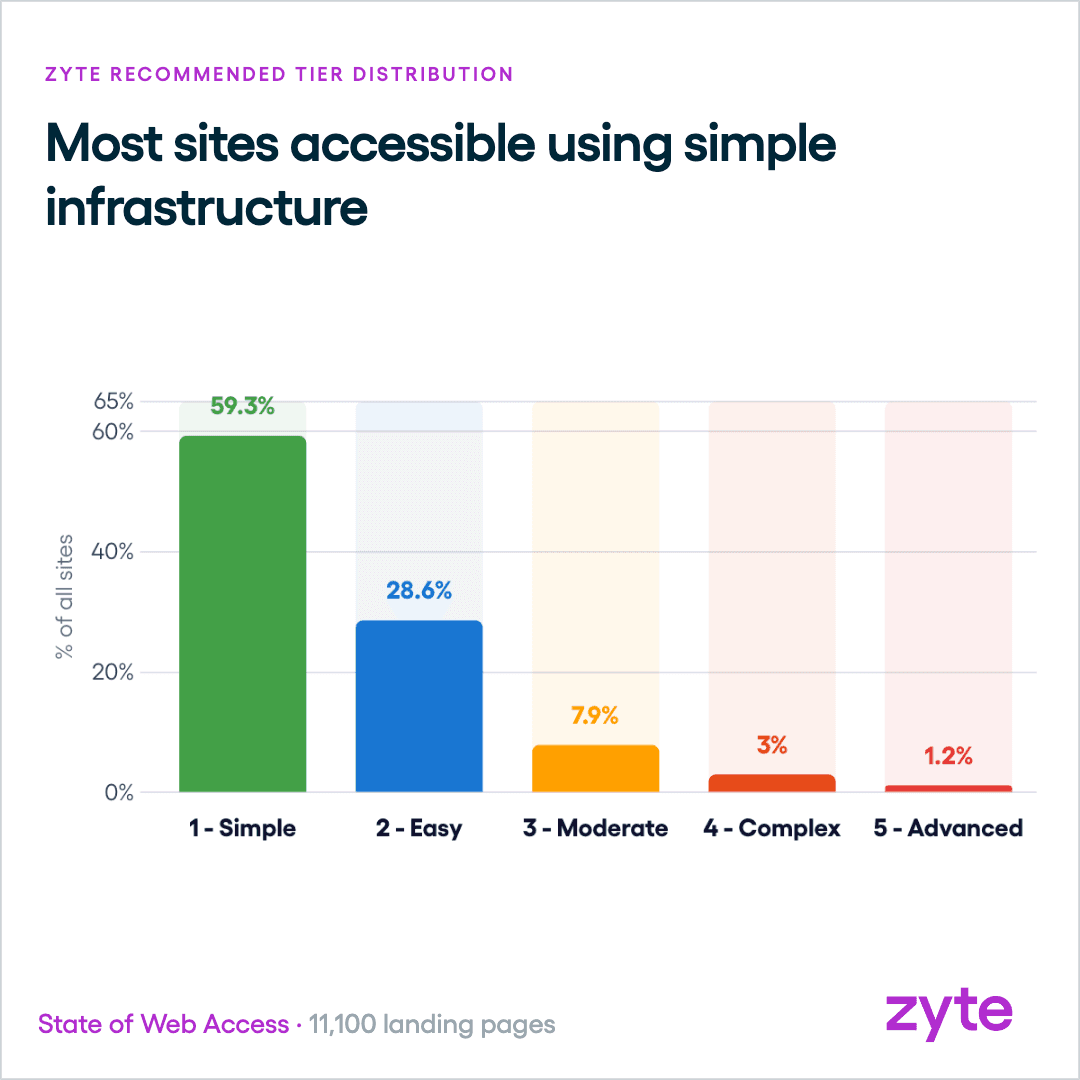
87.9% of popular landing pages sit at Simple or Easy tier. 59.3% require nothing more than a plain HTTP request. A further 28.6% need JavaScript rendering - a headless browser - but nothing beyond that.
The web is not uniformly hard. Complexity concentrates, and concentrates sharply. But the majority of the web remains accessible with appropriate tooling.
The hidden cost of using a headless browser
Before examining the defensive picture, there is a subtler finding in the access method comparison:
- HTTP-only access produces a mean tier of 1.24.
- Switch to a headless browser - even on sites with no intentional access controls whatsoever - and that mean rises to 1.55.
The 0.31-tier gap comes from the inherent overhead of the browser method itself, not from any active defense.
A headless browser presents a richer TLS handshake, announces more cryptographic capabilities, and carries browser-specific headers and protocol signatures. On sites that do TLS fingerprinting, those signatures are checked against a blocklist. On sites that don't, the browser overhead is still present - it just passes without challenge.
The breakdown makes this concrete.
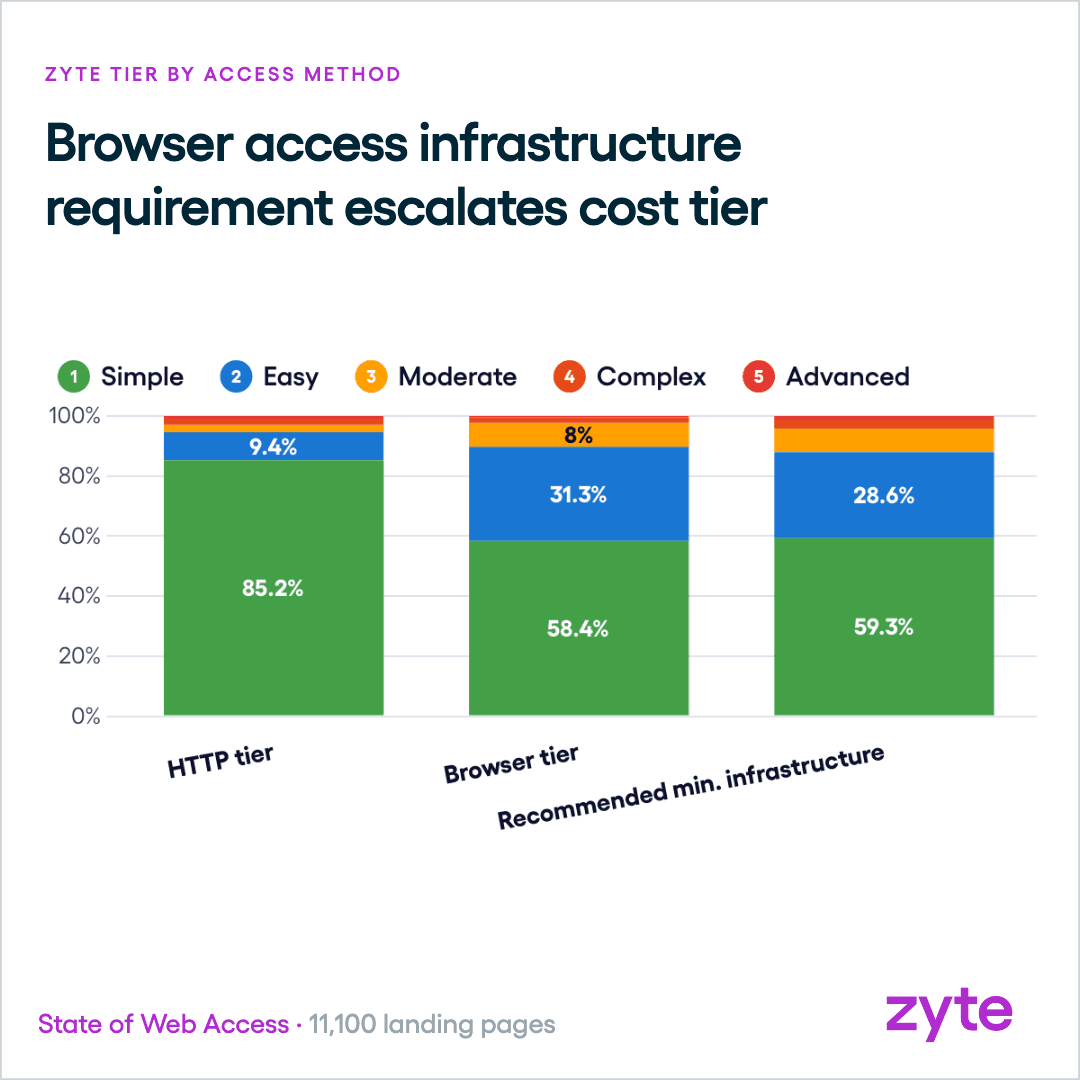
- On HTTP alone, 85.2% of sites land at Simple tier.
- With a headless browser, Simple drops to 58.4% and Easy climbs from 9.4% to 31.3%.
The shift happens because the browser method carries fingerprinting complexity that plain HTTP avoids, not because those sites got harder.
The Recommended tier - Zyte's minimum infrastructure per site, whichever of HTTP or browser access demands more - lands at a fleet mean of 1.58. The browser overhead contributes to that mean even on sites that impose no active access controls.
The 12.1% that demands specialist infrastructure
The remaining 12.1% of sites - those at Moderate, Complex, or Advanced - are where extra access intelligence is needed.
7.9% at Moderate: browser emulation with fingerprint evasion. A standard headless browser presents known signatures; Moderate-tier sites actively check and block them. Defeating this requires a browser instance configured to present a realistic, non-automated fingerprint - matching the TLS parameters, HTTP/2 fingerprint, and header order of a real user agent.
3.0% at Complex: residential proxies or advanced evasion. The site has moved beyond fingerprint checking into IP-reputation and behavioral analysis. Consumer-grade datacenter IPs are blocked by default; access requires residential IP infrastructure, which is meaningfully more expensive per request.
1.2% at Advanced: full specialised infrastructure. These are the most adversarially configured environments on the web - sites where the commercially valuable data has attracted sustained, sophisticated scraping pressure and operators have invested accordingly. Accessing them requires case-by-case analysis and dedicated engineering.
The 1.2% at Advanced represents 133 sites in our dataset. That sounds small. But if those 133 sites are the ones carrying the data you need - high-end e-commerce, financial data, regulated inventory - the 88% figure provides no comfort.
Industry is the strongest predictor
The distribution of tier across industries is the most operationally useful output of the cost analysis.
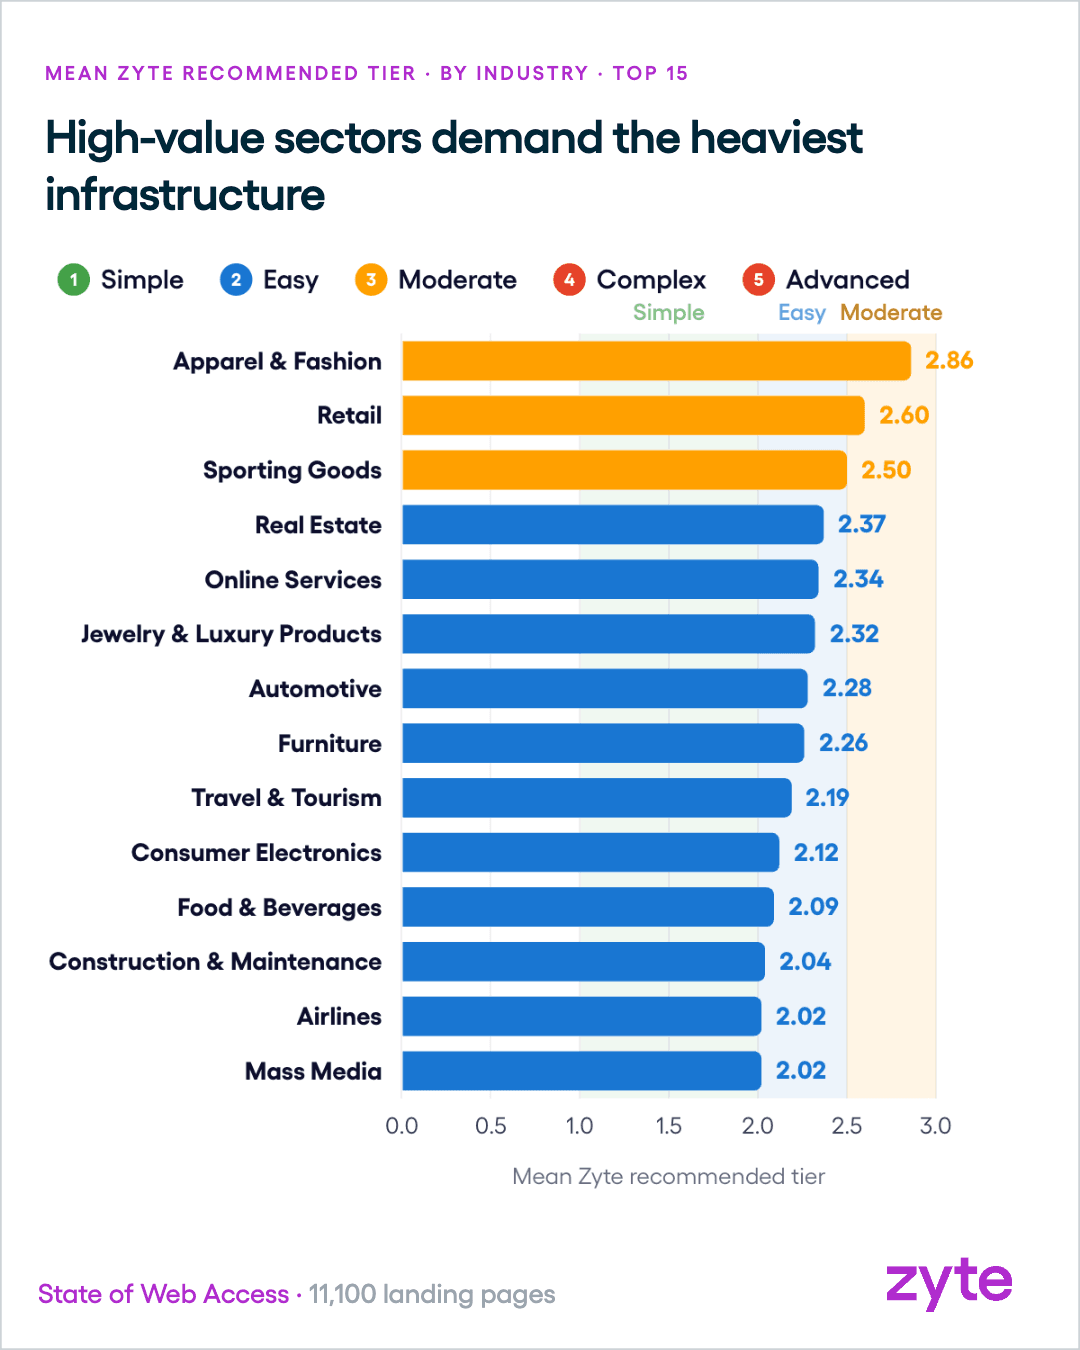
All 14 industries in the top tier chart share a mean recommended tier above 2.0. Every one of them has an average site that requires at minimum a headless browser - and most require significantly more.
Apparel and fashion leads at 2.86, deep into the Moderate zone: the average site in that sector needs browser emulation with fingerprint handling as baseline infrastructure. Retail at 2.60 and sporting goods at 2.50 sit just below Moderate.
The commercial logic is consistent throughout the top-tier list. Fashion, retail, luxury, consumer electronics, real estate, travel: these are sectors where automated price intelligence, competitor surveillance, and inventory extraction have commercial value precise enough to justify the cost of collecting it. That has forced operators to invest in access controls that make collection expensive.
The result is a bilateral arms race - and the mean tier reflects which sectors have pushed furthest.
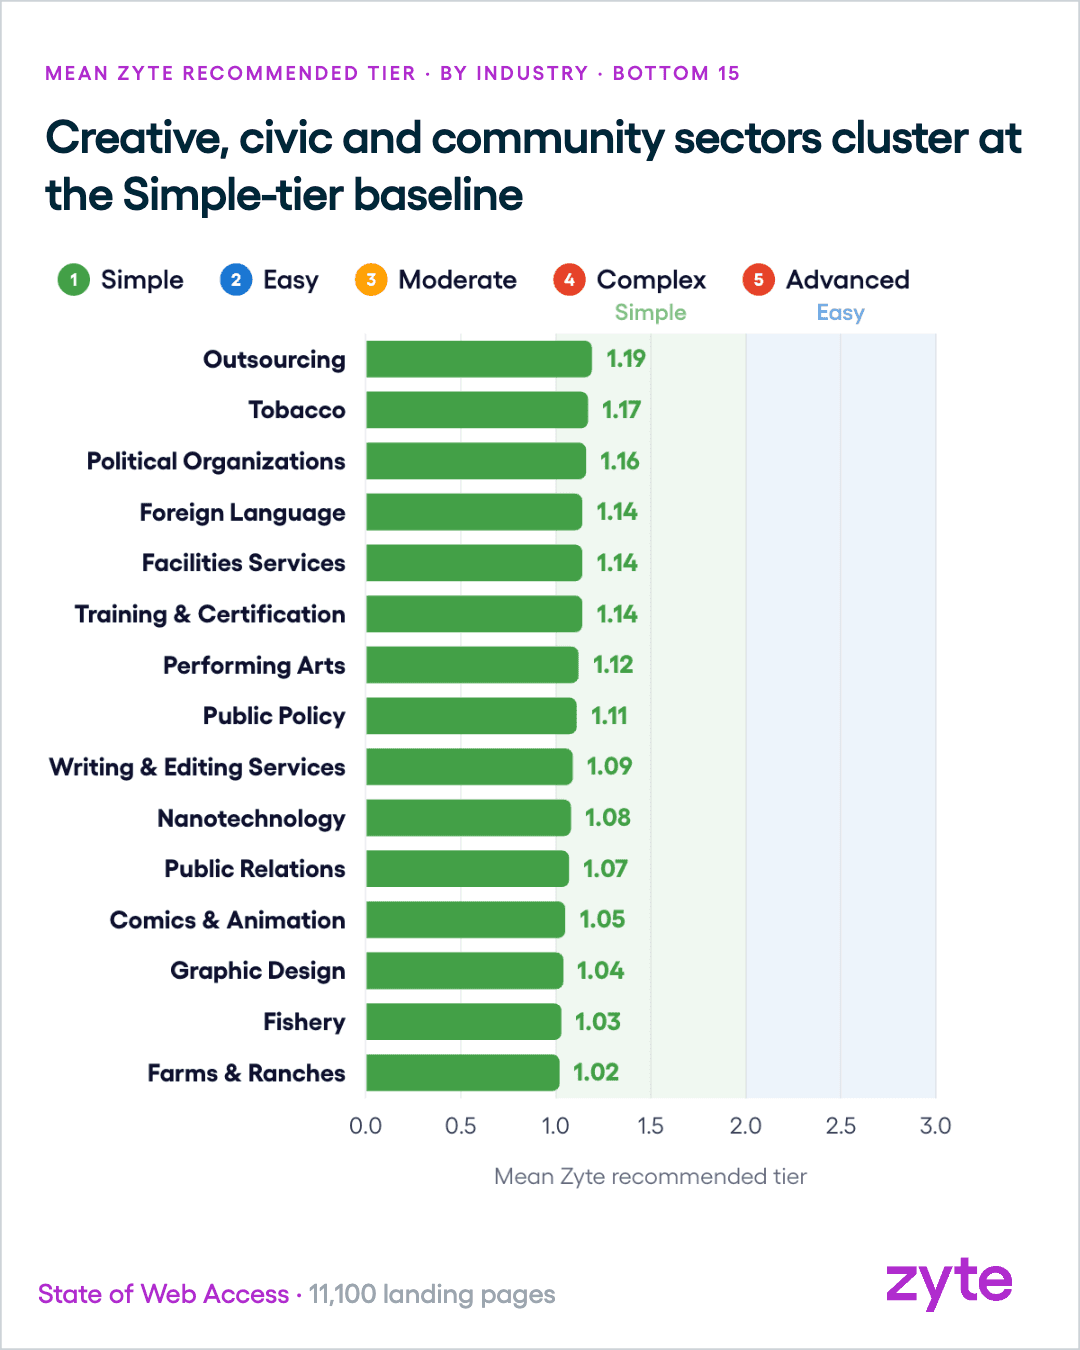
The bottom-tier list is equally coherent, in the opposite direction.
The entire bottom 15 sits within Simple tier, ranging from Farms & Ranches at 1.02 to Outsourcing at 1.19. Comics and animation at 1.05, public relations at 1.07, performing arts at 1.12, graphic design at 1.04. These are sectors where the business model depends on discoverability - where blocking automated access would be self-defeating rather than protective. A crawl pipeline covering these sectors faces essentially zero marginal infrastructure cost.
Industries split between open and locked-down
The 1.84-point spread between the most defended sector (apparel, 2.86) and the least defended (Farms & Ranches, 1.02) represents two fundamentally different commercial postures toward data access:
- At the top, operators who have calculated that controlling data access protects competitive advantage, and have invested accordingly.
- At the bottom, operators for whom discoverability is the asset - who would actively suffer if they made their sites hard to reach.
The fleet mean of 1.58 sits between those poles, pulled upward by the commercially valuable minority that defends aggressively, but anchored by the majority that remains genuinely accessible.
For anyone building a data pipeline, the practical read is this: understanding the commercial model of the industry you're targeting tells you, with reasonable accuracy, where on the tier spectrum you're going to land - before you write a line of code.