Web data in a reactive notebook: an introduction to marimo
Most of us keep a short list of tools we reach for without thinking about it: something to fetch pages, something to hold the rows, something to draw a chart, and a notebook to keep all three in one place. This article is a proposal to add one more to that list, marimo, together with a working notebook to try it on.
marimo is a reactive Python notebook. Its cells form a dataflow graph built from which cells declare variables and which cells read them, so running a cell reruns everything downstream of it and nothing else, instead of leaving you to remember what you clicked and in what order. Its user interface elements are bound to Python values too, which is where the interesting part of this article ends up. It is also not a small project any more: as of Wednesday, August 19, 2026, its GitHub repository sits at 22,393 stars, and it was downloaded 2,625,051 times from PyPI in the preceding month, which puts it in the same order of magnitude as Scrapy, measured at 3,224,433 downloads a month around the same time.
There is a second reason to write this down. marimo's curated gallery, checked on Tuesday, September 1, 2026, holds 103 notebooks across sixteen categories, and not one of them mentions scraping, crawling, or HTTP. Going by their descriptions they all start from data that already exists: a CSV someone saved, a dataset someone else collected. Collection is treated as the step that happens elsewhere and finishes before the notebook opens. It does not have to be, and a reactive notebook is an unusually good place to put it, because the fetch is normally the slowest and most expensive thing in the file, and a dataflow graph is exactly the thing that knows when not to repeat it.
What makes marimo different
Three properties do the work here, and each shows up later in something concrete.
The execution model is reactive, so a cell that reads a variable reruns whenever the cell that defines it runs. In the default configuration that means you do not get stale output, because marimo reruns whatever depended on the thing you changed. You can turn autorun off when the work is expensive, and marimo then marks the affected cells as stale rather than leaving them looking current.
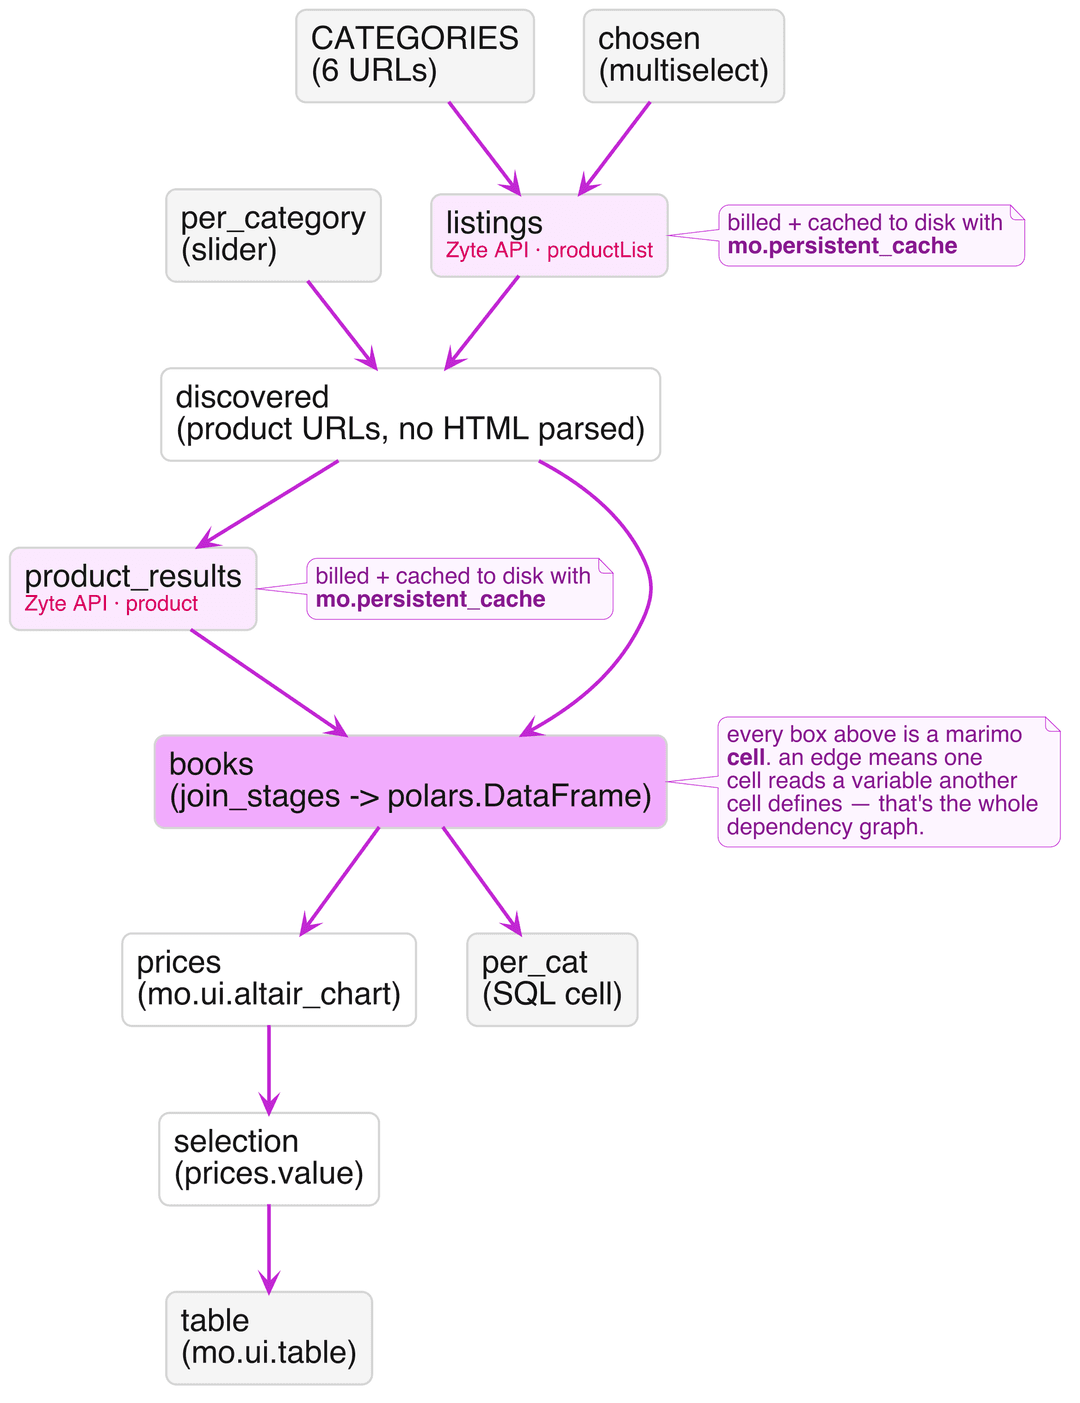
That rule is the whole notebook, drawn once. Every box below is a cell, and an edge is one cell reading a variable another cell defines — nothing more exotic than that builds the graph the two Zyte API calls, the join, the chart, and the table all sit on:
The file is plain Python. A marimo notebook is a .py file, which means it goes through code review as a diff, runs under python at the command line, and can have its top-level functions imported by other files. There is no JSON envelope wrapped around your code.
The user interface elements are bound to Python values. When you assign mo.ui.slider(...) to a global variable and then reference that variable in another cell, marimo reruns that cell every time the slider moves, with the new value already in place. marimo's documentation states the rule directly: "When a UI element assigned to a global variable is interacted with, marimo automatically runs all cells that reference the variable (but don't define it)."
Everything below lives in one file, notebook.py, including its dependency list, which sits in a PEP 723 header at the top so that uv can resolve it with no install step:
1# /// script
2# requires-python = ">=3.11"
3# dependencies = [
4#     "marimo",
5#     "zyte-api",
6#     "polars",
7#     "altair",
8#     "duckdb",
9#     "sqlglot",
10# ]
11# ///Building the scraper in two stages, with no selectors
The notebook scrapes books.toscrape.com, which is a catalogue that exists so that people can practice scraping it. Its own footer says so: "This is a demo website for web scraping purposes. Prices and ratings here were randomly assigned and have no real meaning." Worth knowing before you read a price chart built on those prices. It changes nothing about the mechanics, which are the two stages any catalogue scrape needs: find the product URLs, then fetch each product.
What is worth noticing is that neither stage involves a CSS selector or a line of HTML parsing. Zyte API has two extraction types that map onto the two stages directly, productList for a listing page and product for a product page, and both return structured records. If you have not used this before, the closing section of my earlier article on Scrapy item types covers what automatic extraction hands back and how it maps to a fixed schema.
Stage one asks for the listing:
1from zyte_api import ZyteAPI
2client = ZyteAPI(api_key=api_key)
3queries = [{"url": u, "productList": True} for u in category_urls]
4listings = list(client.iter(queries))Six category pages came back with 105 product URLs between them, along with the category name for each page, which saves deriving it from the breadcrumb trail. The client's iter method sends the requests in parallel, up to 15 concurrent connections by default, and yields each result as it arrives rather than making you wait for the slowest one. Parallel is not instant, though: the cold run further down made all 111 requests in 104.7 seconds. One detail the snippet above glosses over is that iter yields an exception in place of a result when a request fails, so real code needs an isinstance(item, Exception) branch, which the notebook has.
Stage two asks for each product, with the same call shape and product in place of productList. That gives the full record: the name, the price, the currency, the availability, and the stock keeping unit.
Here is the part I did not expect, and it is the reason the second stage earns its cost. On the listing pages, 59 of the 105 book names were truncated, arriving as strings like In a Dark, Dark ..., because the catalogue's own listing markup cuts them short. All 59 came back complete from the product pages. The prices, on the other hand, were identical between the two stages for all 105 records, every single one. So stage two is not buying you better prices, and if prices were all you needed, six requests would have done the job instead of 111. Stage two is buying you names.
What the extraction actually returns
Three details about the returned data will save you a debugging session, and the notebook's tests pin all three so they stay honest.
Every price arrives as a JSON string. The record reads "19.63", not 19.63, so anything numeric needs an explicit cast before it reaches a chart. Related, and more useful than it first looks: the currency is split from its symbol, with currency holding "GBP" and currencyRaw holding "£", which means nothing in your code has to parse £19.63 apart. Availability comes back normalized against schema.org, so it reads "InStock" rather than whatever phrasing the page happened to use.
The third detail is the one to take seriously. Every record carries a metadata.probability value, because automatic extraction is probabilistic rather than guaranteed. Across all 105 product records the probability sat at 0.99 or above, which is reassuring, but I saw the other end of that range by accident: while writing the notebook I guessed at a product URL rather than using one that stage one had discovered, and the guess did not exist. Zyte API still returned a product record for it. The name was 404 Not Found, every other field was null, and the probability was 0.10. That number is the signal, and a pipeline that ignores it will happily store a page of nothing as a product. Filter on it.
Dragging a selection on the chart back into Python
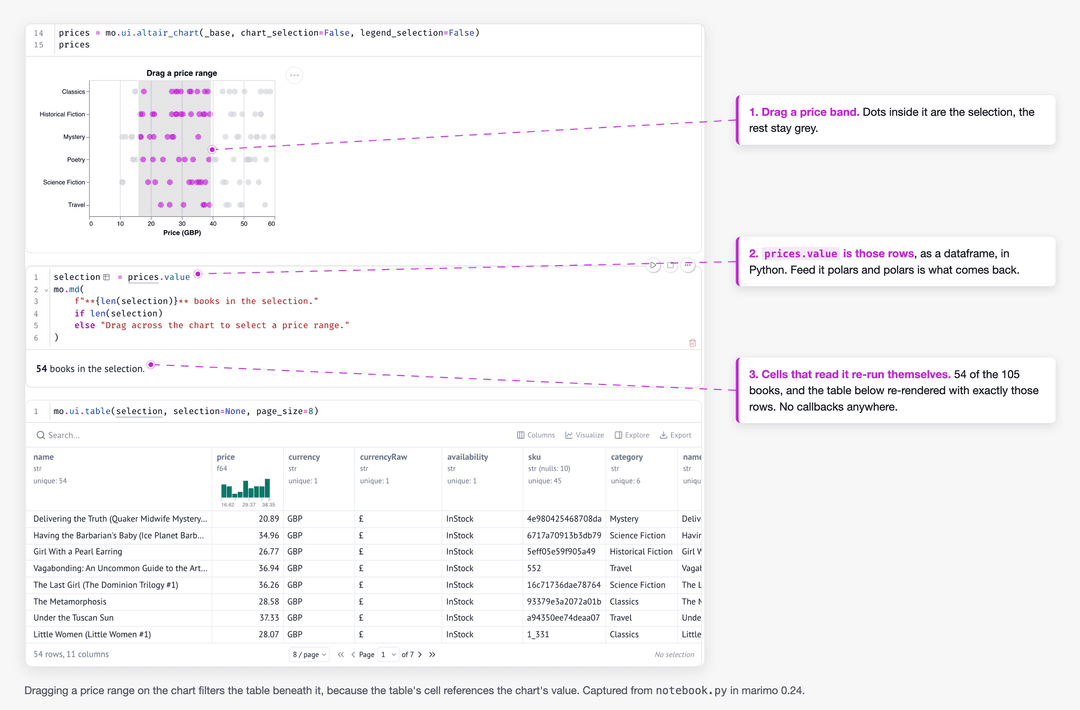
This is the section the article exists for. In marimo you can wrap an Altair chart in mo.ui.altair_chart, and the selection a reader makes with the mouse becomes a dataframe in Python, in a cell that reruns automatically. marimo's documentation states it plainly: "selections you make on the frontend are automatically made available as Pandas dataframes in Python." In practice the frame you get back matches the frame you put in, so feeding it polars gives you polars.
1brush = alt.selection_interval(encodings=["x"])
2base = (
3    alt.Chart(books)
4    .mark_circle(size=90, opacity=0.65)
5    .encode(
6        x=alt.X("price:Q", title="Price (GBP)"),
7        y=alt.Y("category:N", title=None),
8        color=alt.condition(brush, alt.value("#c026d3"), alt.value("#cbd5e1")),
9        tooltip=["name", "category", "price", "availability", "probability"],
10    )
11    .add_params(brush)
12)
13prices = mo.ui.altair_chart(base, chart_selection=False, legend_selection=False)Then, in a different cell, the selected rows are simply available:
1mo.ui.table(prices.value, selection=None, page_size=8)That is the whole mechanism. Drag across a price band on the chart and the table below it shows exactly those books, because the table's cell references prices, and marimo reran it the moment the selection changed. You can get to something similar in Jupyter with ipywidgets and a callback, but it is a noticeably larger amount of machinery for the same result, and it is the machinery that tends to break when someone else opens the notebook.
Worth being precise about what "reran" means here, because it is the part a linear notebook cannot do. The drag only invalidates the two cells that actually read prices. It does not touch books, and it does not touch either of the two Zyte API calls, so dragging the chart back and forth all afternoon spends no additional credit: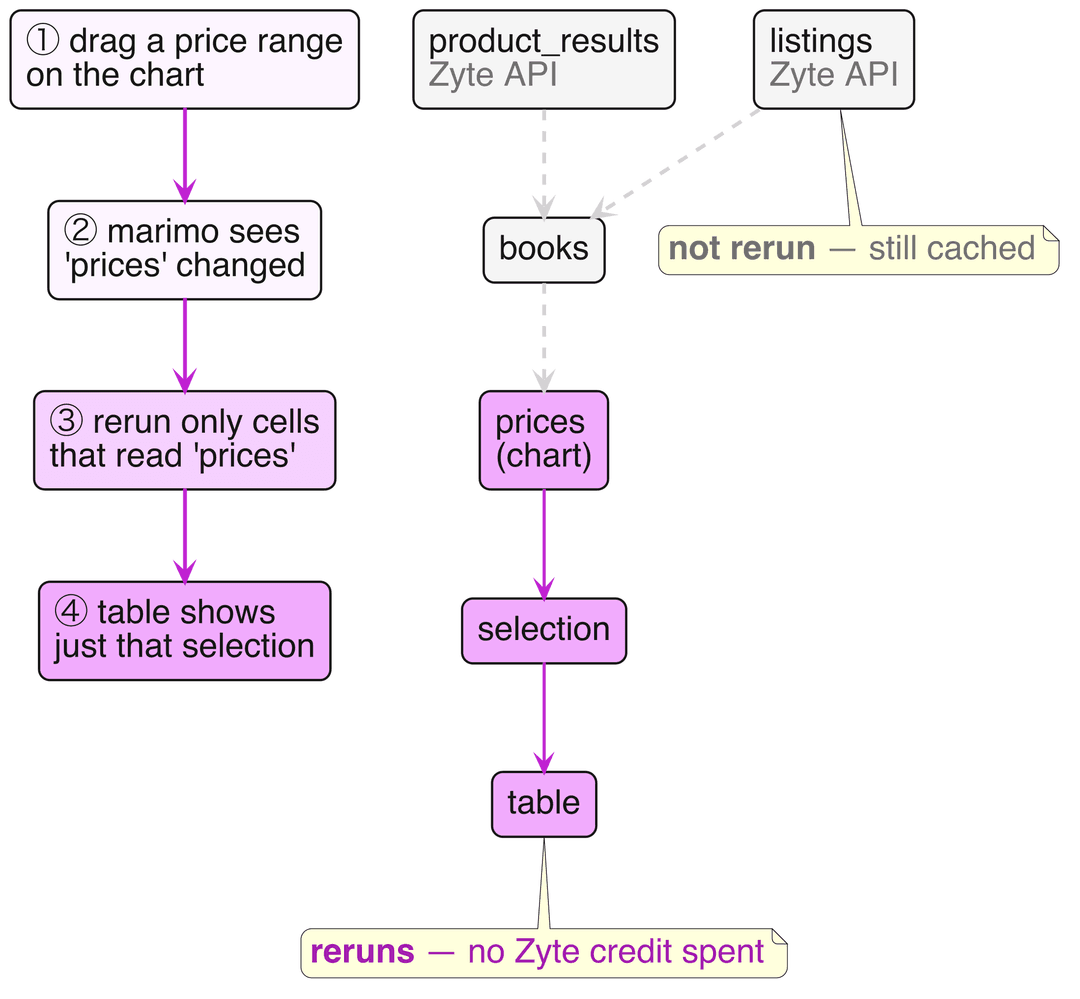
Two practical notes. marimo adds a default selection based on the chart's mark type, and when you want to control that behavior yourself its plotting guide tells you to set chart_selection and legend_selection to False and add the selection to the Altair chart directly with .add_params, which is exactly what the code above does. And selections stream to Python as you drag, which is fine at this size and worth debouncing if the downstream work is expensive.
Asking the same dataframe a SQL question
marimo also has SQL cells, which run against your existing dataframes rather than requiring a database, and which return a dataframe so the result flows onward like anything else. Having scraped into polars, I can group the same data without switching mental models:
1SELECT
2    category,
3    count(*)                AS books,
4    round(median(price), 2) AS median_price,
5    sum(was_truncated::int) AS truncated_names
6FROM books
7GROUP BY category
8ORDER BY median_price DESCFor a certain kind of question, and grouped aggregates are exactly that kind, this is simply the clearer way to write it.
Keeping a metered API from surprising you
Zyte API is billed per successful request, so a notebook that fetches on every keystroke would be an expensive notebook. marimo's guide for expensive notebooks opens by framing the goal as preventing "expensive cells, which may call APIs or take a long time to run, from accidentally running," which is a fair description of the problem.
The notebook uses two mechanisms. The first is a gate, so that opening the file sends no requests at all:
1headless = mo.app_meta().mode == "script"
2mo.stop(
3    not headless and not fetch.value,
4    mo.md("Press **Fetch through Zyte API** above. No requests are sent until you do."),
5)The second is a disk cache on the function that does the fetching, using mo.persistent_cache, whose cache key includes the arguments, so re-running with the same URLs and the same requested fields reads from disk instead of calling the API again. The effect is easy to measure: the cold run against an empty cache took 104.7 seconds for 111 requests, and the next run took 1.1 seconds, made no API calls at all, and produced the same 105 rows. On the pricing side, this scrape used two data types, since productList and product are billed separately, and Zyte's pricing page puts automatic extraction at $0.0004 to $0.0016 per data type before volume discounts, with rate-limited and unsuccessful responses free. If you want the account-level version of the same discipline rather than the notebook-level one, Zyte shipped spending controls and usage insights in May 2026.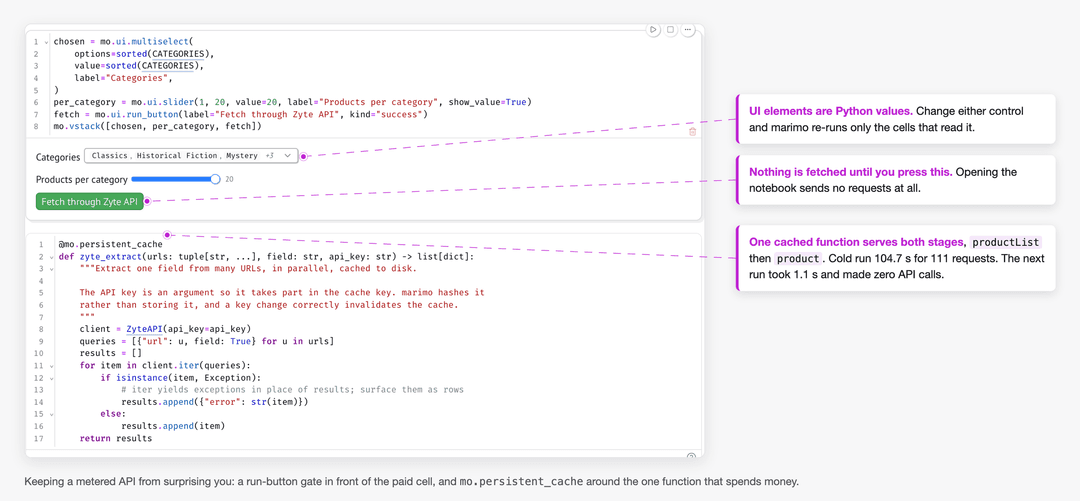
That mo.app_meta().mode check in the gate is worth a second look, because it is what makes the next section work.
The same file as an app and as a cron job
marimo reports its mode as edit in the notebook, run in an app, and script when the file is executed by Python. The gate above only applies in the first two, where there is a human present to press a button, which means the identical file runs unattended without modification:
1uvx marimo edit --sandbox notebook.py   # the notebook
2uvx marimo run --sandbox notebook.py    # an app, with the code hidden
3uv run notebook.py # a plain script, for cronThe middle command is the one I would not have predicted finding useful. It serves the same notebook as a small web application with the code hidden and only the inputs, the chart, and the table showing, which is a reasonable thing to hand to a colleague who wants to look at prices and does not want to look at Python.
What you give up
An honest comparison has to include the costs, and marimo documents its own.
Because the file is Python rather than JSON, your outputs are not stored in it, so a notebook in version control shows the code and not the plots. There is a setting that snapshots to HTML or ipynb alongside the file, and marimo export ipynb for when you need the other format.
IPython magics do not work, so %pip, %%time, and !ls all need replacing, and marimo publishes a table of equivalents for the common ones.
The restriction that takes the longest to absorb is that the same variable cannot be defined in more than one cell, which is what allows marimo to build the graph in the first place. If you are used to redefining df in six consecutive cells as you clean it up, that habit has to go: merge the cells, alias the dataframe, or prefix throwaway variables with an underscore to make them local to a cell.
If you already have a notebook you like, the conversion is one command, and it is a reasonable way to see what your own code looks like under a dataflow model:
1marimo convert your_notebook.ipynb -o your_notebook.pyTry it yourself
The notebook, its tests, and the fixture behind them are on GitHub at zytelabs/zytelabs-marimo-web-data, and the whole thing is one file plus a dependency header, so there is nothing to install beyond uv. The 18 tests are deliberately offline and run against a saved response set, which means every number in this article can be re-checked without spending a Zyte credit. Signing up for Zyte API comes with $5 of free credit for the first billing month, and because the notebook caches to disk, going back for a second look at the same data costs nothing.
The gallery gap I opened with is still there: nothing in it goes and gets its own data, and this one is my attempt at the first. It is a thin category to be the only entry in, so if you build something in the same shape, publish it and say so.
And if the reactive idea appeals to you but your interest is in giving tools to an agent rather than to a person, I wrote about giving a coding agent a fetch tool that survives the real web in August 2026. Either way the argument is the same one. The notebook is a perfectly good place to go and get the data, and treating it as somewhere you only inspect data that arrived by other means sells it short.