A fashion retailer cuts the price of a jacket at lunchtime. A property portal lists an apartment that will be gone by Friday. An airline moves a fare three times before dinner.
Each of those pages carries information that competitors, comparison services and analysts want to track, and each is published by a business that knows it.
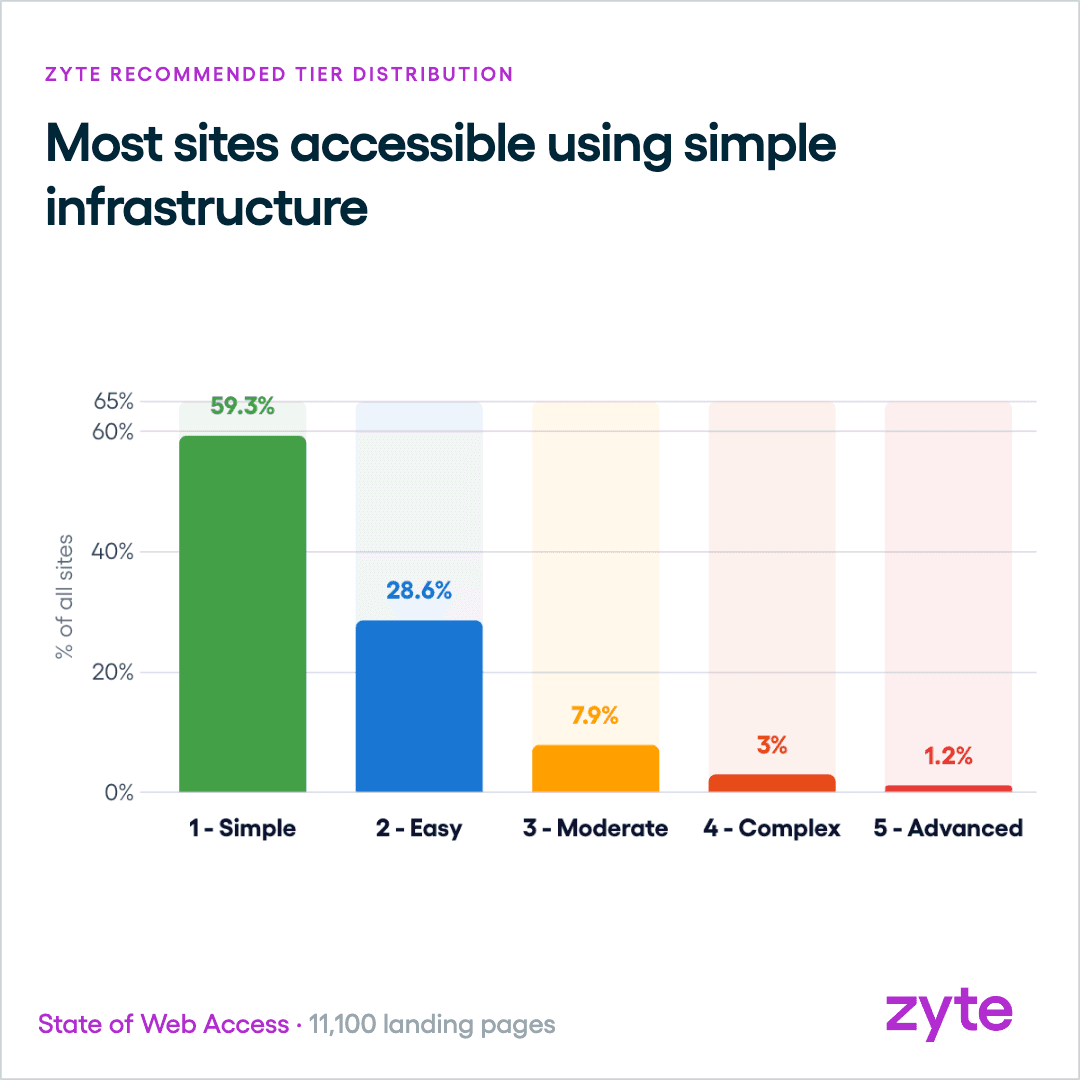
Those are the sites that sit at the top of Zyte's State of Web Access 2026 difficulty scale. The study rates every site against Zyte API's five-tier access complexity model, from Simple (a plain HTTP request) to Advanced (full specialised infrastructure). Only 3.0% of the 11,100 landing pages it audited land at Complex, and just 1.2%, 132 sites, reach Advanced. Another 48 rated beyond the top of the scale on at least one access method, bringing the hardest corner of the web to 180 sites.
Which industries are hardest to scrape?
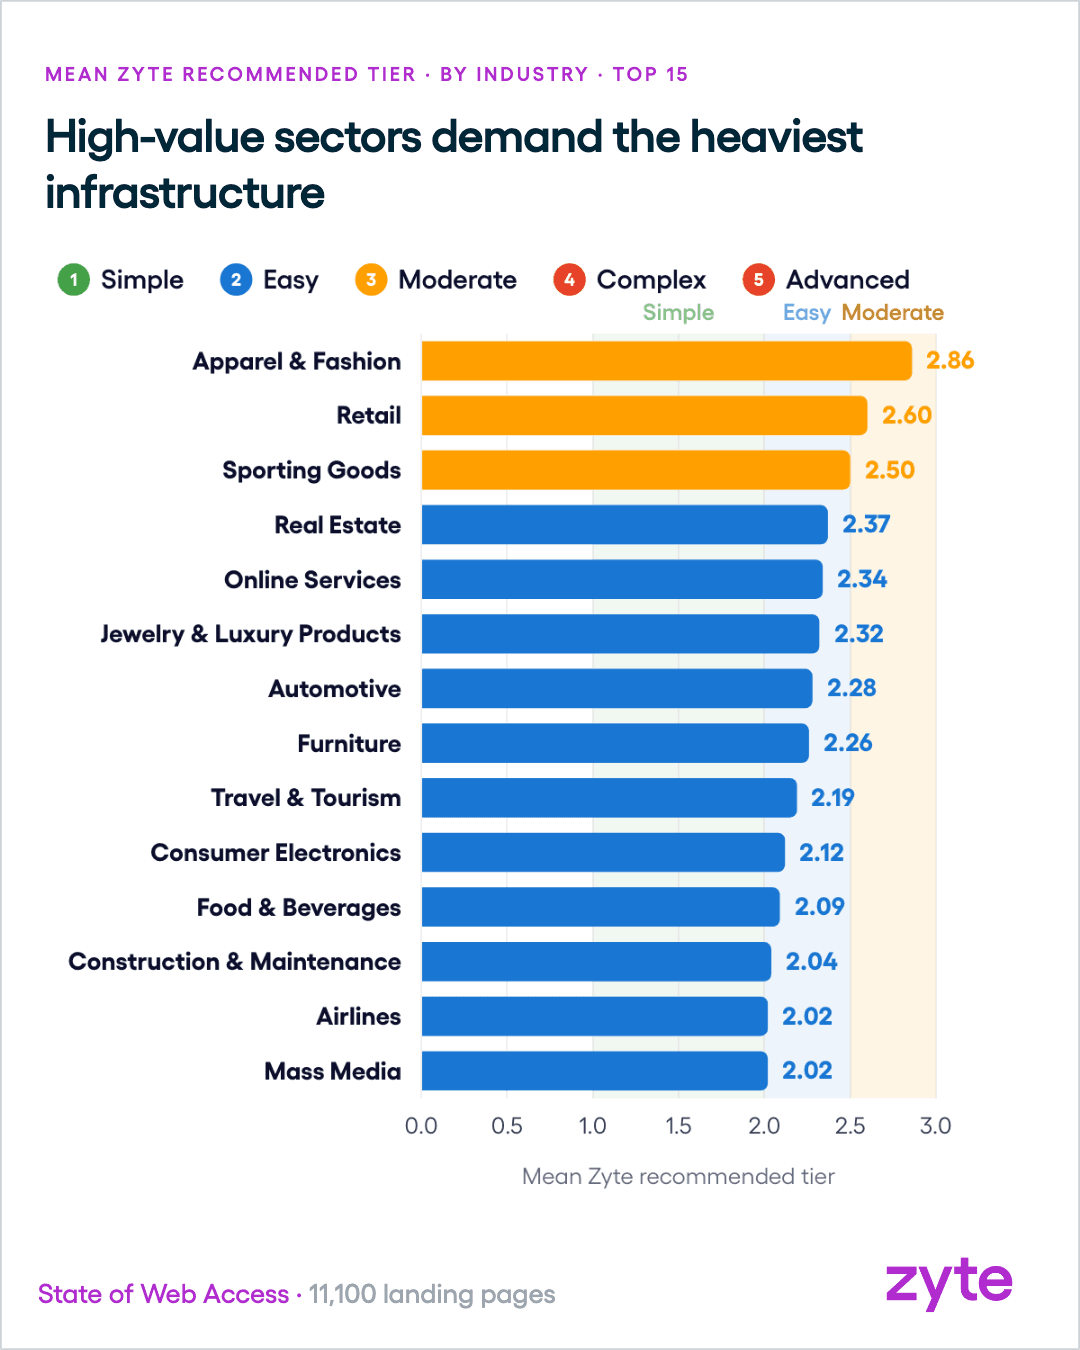
Ranked by mean recommended tier, the hardest categories are almost all places where people buy things. Against a research-wide average of 1.58, every one of them sits well above the baseline, and several have more than one site in five rated Complex or harder.
| Category | Mean recommended tier | Sites rated Complex or harder |
|---|---|---|
| Apparel and fashion | 2.86 | 29% |
| Retail | 2.60 | 21% |
| Sporting goods | 2.50 | 19% |
| Real estate | 2.37 | 22% |
| Online services | 2.34 | 15% |
| Jewellery and luxury products | 2.32 | 17% |
| Automotive | 2.28 | 15% |
| Furniture | 2.26 | 10% |
| Travel and tourism | 2.19 | 15% |
Retail and e-commerce makes up 16% of the study's sample but 32% of its 180 hardest sites, more than any other group by a wide margin. Real estate and automotive are smaller groups, yet each turns up at the top of the scale even more often relative to its size. At the other end, public-sector, media and financial-services sites appear among the hardest at less than half the rate their size would predict.
| Industry group | Share of all sites | Share of the hardest sites | Relative to size |
|---|---|---|---|
| Real estate | 0.9% | 2.8% | 3.1x |
| Automotive | 0.9% | 2.2% | 2.5x |
| Retail and e-commerce | 16.2% | 32.2% | 2.0x |
| Travel and hospitality | 5.4% | 8.3% | 1.5x |
| Public sector | 4.5% | 2.2% | 0.5x |
| Media and publishing | 5.4% | 2.2% | 0.4x |
| Financial services | 5.4% | 1.7% | 0.3x |
Why shops defend hardest
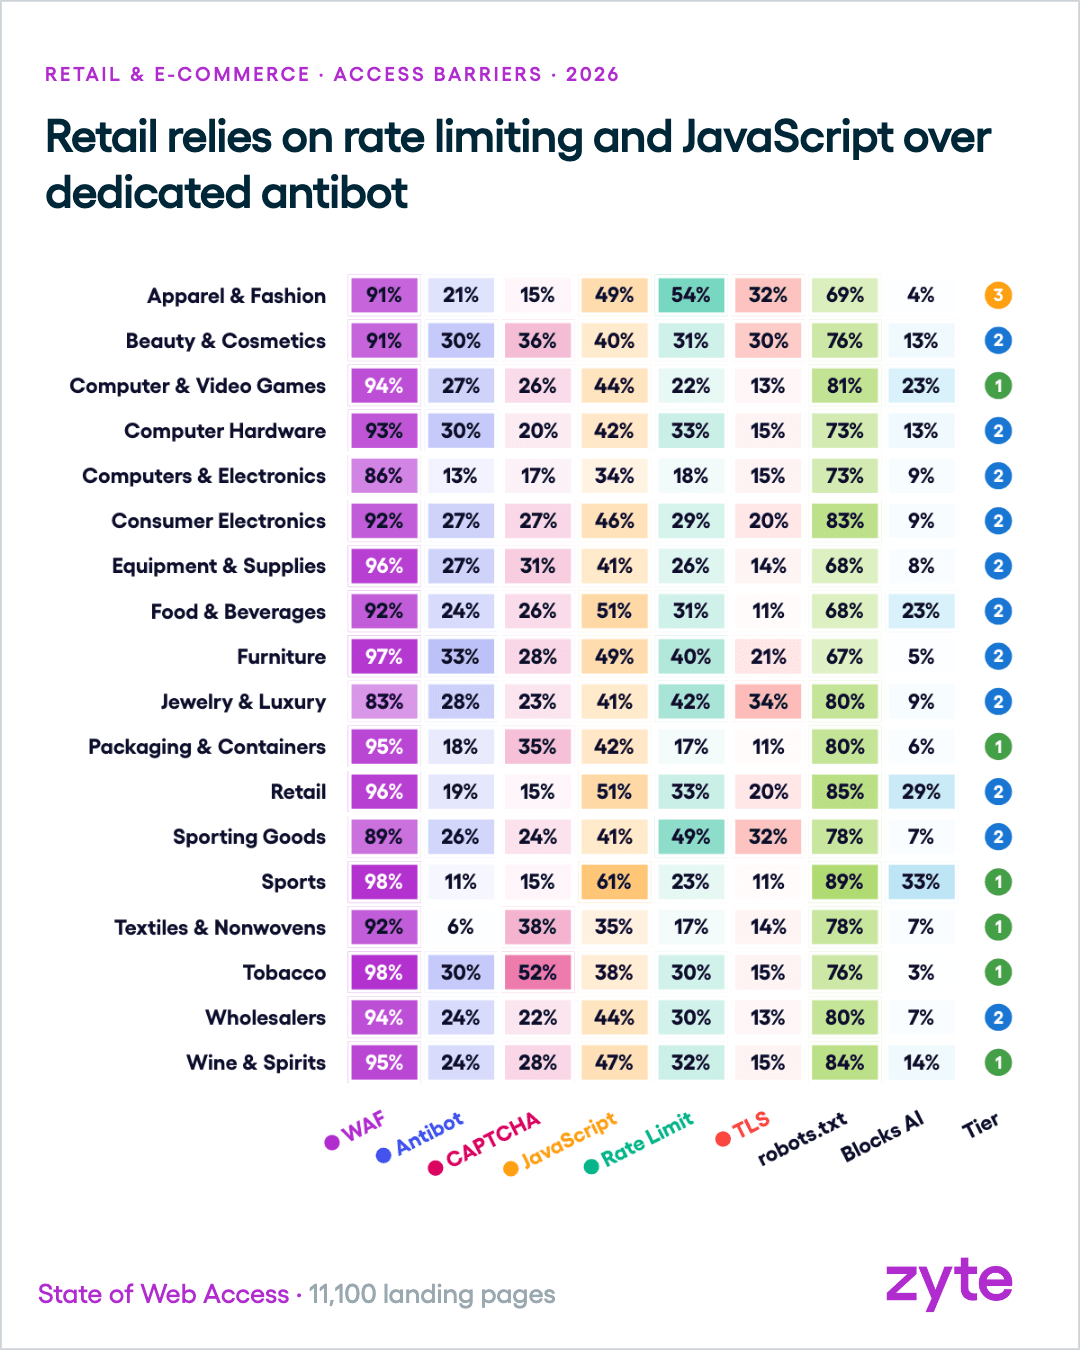
Retail prices are public by design, and that is exactly what makes them valuable to collect. Competitors watch each other's listed prices, stock levels and promotions as routine market intelligence, and comparison services build whole businesses on aggregating them. At the same time, retailers contend with automated buyers that strip limited products from shelves the moment they go on sale.
The pressure is measurable well beyond this study. The 2025 Imperva Bad Bot Report found that automated traffic made up 51% of all web traffic in 2024, outnumbering humans for the first time in a decade, and that retail accounted for 15% of the bot attacks it recorded.
Fashion sits at the very top of the State of Web Access ranking, a story covered in depth in our fashion analysis.
Real estate: the listing is the inventory
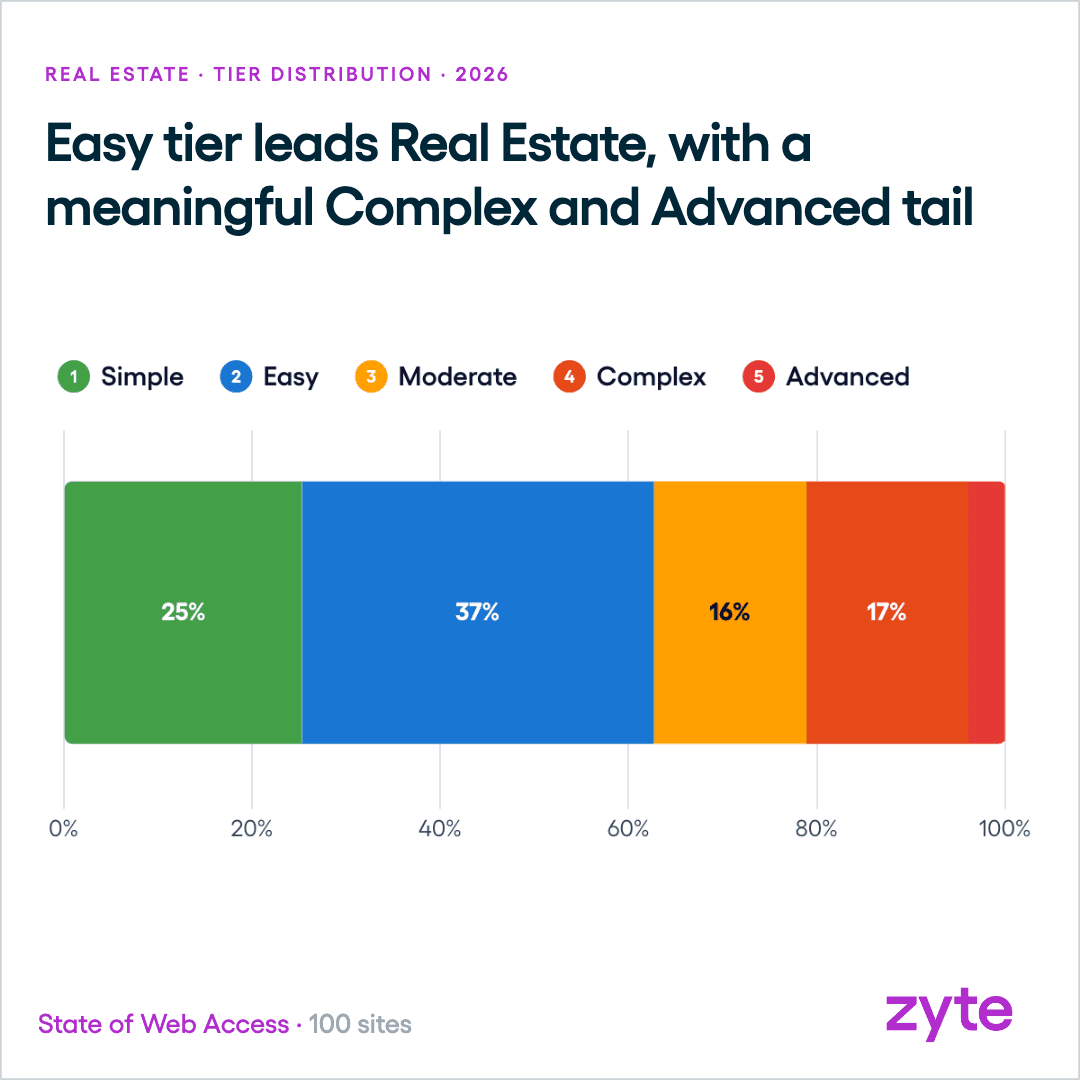
Real estate is the hardest industry group in the study by share of difficult sites: more than one in five property sites rate Complex or Advanced.
A property portal's listings are its product. The real-estate industry has fought unlicensed copying of listing data for years, with some listing services planting fictitious "seed" listings in their feeds to trace where their data ends up, a practice described in the National Association of Realtors' guidance on MLS data security.
Travel: fares that move by the minute
Airlines and travel sites round out the hardest tier. Imperva ranked travel as the single most targeted industry in 2024, with 27% of all bot attacks.
Airlines have also gone to court over fare collection. Ryanair has pursued online travel agents in the US over screen scraping of its fares, including Expedia and Booking.com, and a US court granted Southwest Airlines a preliminary injunction against an online travel site that collected its fare data. In a sector where a fare is only valid for minutes, the published price is commercially sensitive in a way that a government notice never is.
What makes a site hard to scrape?
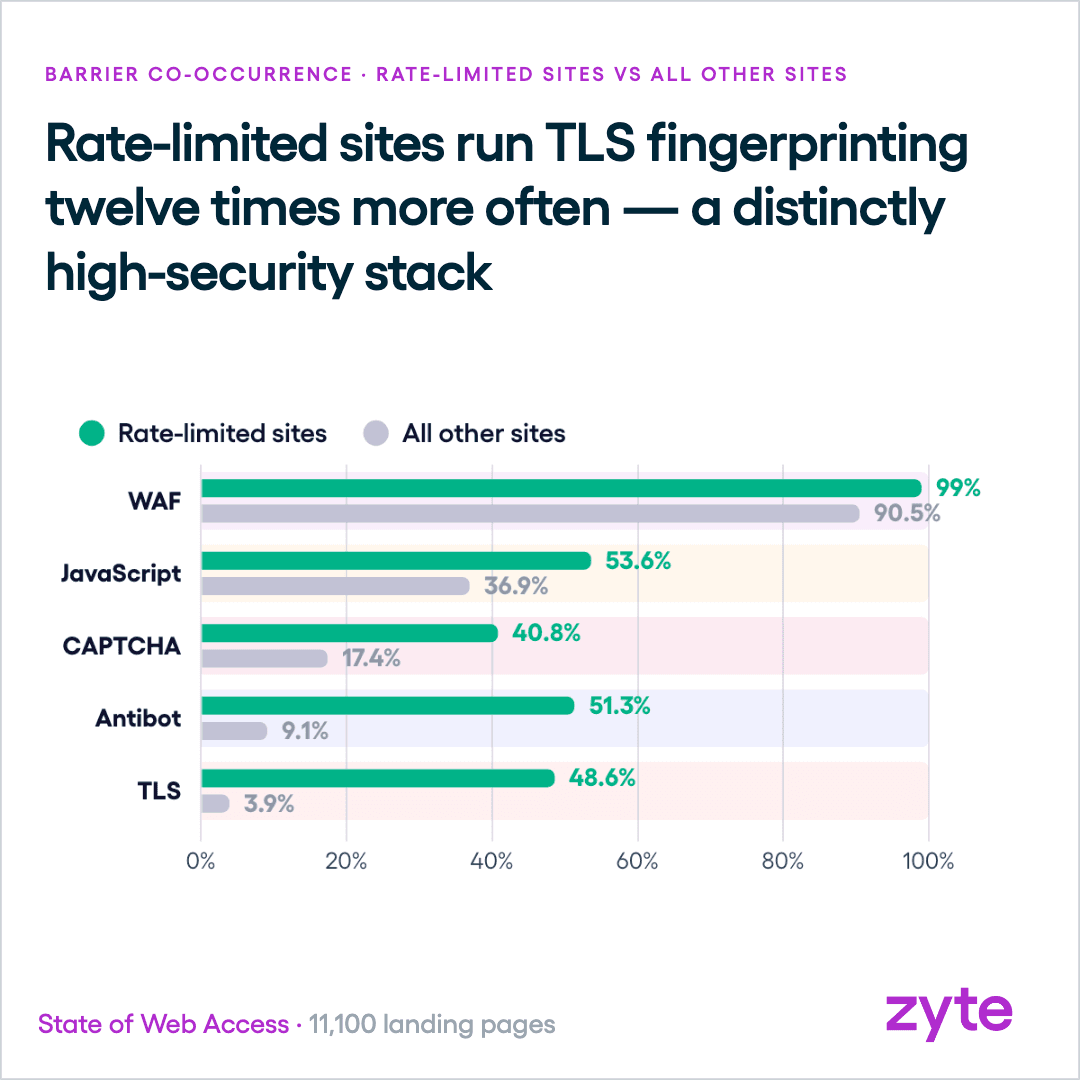
The hardest sites lean on controls a visitor never sees. Set against the research-wide rates, sites at Advanced or beyond run every barrier more often, but by very different margins:
| Barrier | Hardest sites | All sites | Difference |
|---|---|---|---|
| Rate limiting | 59% | 22% | 2.7x |
| Antibot | 34% | 18.5% | 1.8x |
| TLS fingerprinting | 23% | 14% | 1.7x |
| JavaScript | 55% | 41% | 1.4x |
| CAPTCHA | 26% | 22.5% | 1.1x |
The CAPTCHA row is telling. Rather than asking visitors to solve a puzzle, the hardest sites make their decision silently, at the connection and request level, before a shopper notices anything.
The details reinforce the point:
- Of the hardest sites that rate-limit, 95% block with a
403 Forbiddenresponse rather than the polite429 Too Many Requests, which tells a client nothing about when, or whether, it can come back. - Among the hardest sites that require JavaScript, the median page loses all of its content when it is fetched without a browser.
- The antibot vendor mix shifts at the top. PerimeterX, now part of HUMAN Security, accounts for 18% of antibot deployments on the hardest sites, against under 5% across the whole study, though the numbers involved are small.
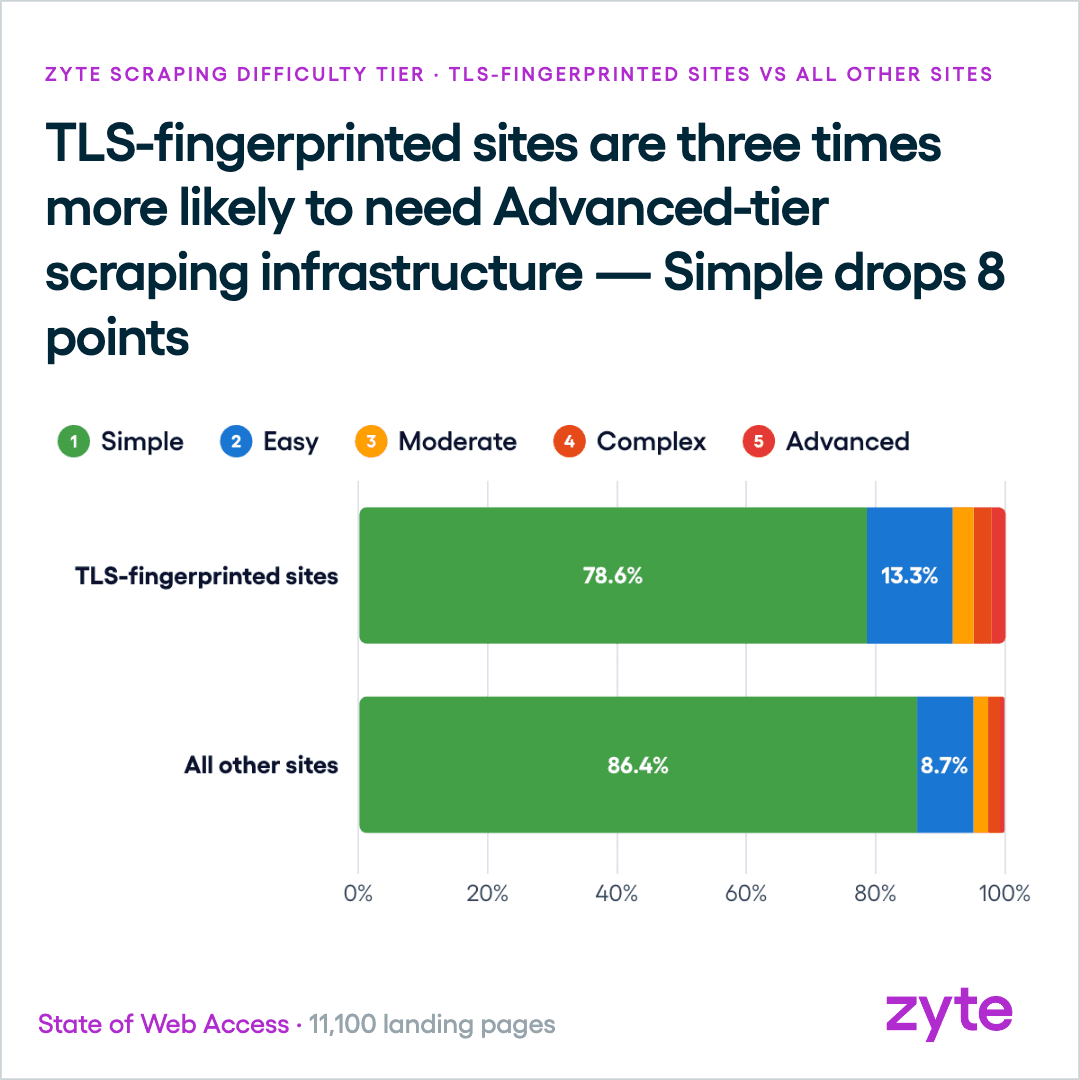
TLS fingerprinting is a particularly strong marker. Sites that screen connections at the handshake are three times as likely as other sites to need Advanced-tier infrastructure.
Does running more barriers make a site harder?
Not necessarily, and this is one of the more counterintuitive findings in the data.
Only 91 sites in the study run all six barriers at once. Most of the 78 with a measured Zyte API tier still turn out to be straightforward to reach:
| Sites running all six barriers | Sites | Share |
|---|---|---|
| Simple or Easy | 60 | 77% |
| Moderate | 5 | 6% |
| Complex or harder | 13 | 17% |
Only two sites both run all six barriers and rate beyond the top of the scale.
The reverse also happens. Of the 180 hardest sites, 20 showed none of the six barriers the study can detect, including several in the maritime sector, an industry whose published freight rates feed an entire market of rate indices. Their difficulty comes from controls outside the study's scan, such as custom logic or deeper-page defences.
Configuration counts for more than quantity. A firewall at default settings and a firewall tuned to challenge automated traffic register identically in a barrier count, a gap explored in our analysis of WAF adoption.
Does difficulty depend on how you ask?
Often, yes. Zyte API rates each site twice, once for a plain HTTP request and once for a headless browser, and the recommended tier takes whichever is harder.
Among the 180 hardest sites, 62 were rated hardest for plain HTTP yet rated Easy or below when visited with a browser. Another 37 showed the opposite pattern. For a large share of the web's toughest sites, choosing the right method matters as much as raw infrastructure.
Are the hardest sites the biggest?
Largely. The median hardest site draws 9.6 million visits a month, about four times the research-wide median of 2.3 million.
The share of sites rated Complex or harder rises at every step up in traffic:
| Monthly visits | Sites rated Complex or harder |
|---|---|
| Under 350,000 | 1.0% |
| 350,000 to 1.5 million | 2.1% |
| 1.5 million to 4.2 million | 4.5% |
| 4.2 million to 21.5 million | 7.0% |
| Over 21.5 million | 8.6% |
Scale brings more valuable data, more automated traffic and the budget to defend against it.
The hardest sites also say less about their rules. Only 62% publish a robots.txt file, against 76% across the study, so they rely on technical controls rather than stated preferences.
What this means if you work with the hardest sites
For anyone collecting publicly listed data from the top of the difficulty scale:
- Budget for a small number of expensive domains. The hardest sites are few, but they are often the ones that matter most commercially. Zyte API's pricing charges for the difficulty each site actually presents, so the cost concentrates where the difficulty is.
- Test both HTTP and browser access. A site that is Advanced over plain HTTP may be Easy in a browser, or the other way round.
- Read a
403correctly. On the hardest sites, an early block is almost always about client identity rather than request speed, so slowing down rarely helps. See our rate limiting analysis. - Expect layers. A site that rate-limits or fingerprints TLS is likely running several other controls at the same time.
The hardest sites to scrape are hard for a commercial reason. Their prices, listings and fares are worth watching, so they invest heavily in deciding who gets to see them.
Key takeaways: The hardest sites to scrape, in six numbers
The top of the difficulty scale belongs to commerce:
- 1.2% of the web's most popular landing pages need Advanced-tier infrastructure, and 48 more rate beyond the top of the scale.
- 32% of the 180 hardest sites are in retail and e-commerce, a group that makes up 16% of the sample.
- 2.86 of 5 is the mean recommended tier in apparel and fashion, the highest of any industry.
- 59% of the hardest sites run rate limiting, against 22% research-wide.
- 77% of sites running all six barriers with a measured tier still rate Simple or Easy.
- 4x the monthly traffic: the median hardest site draws about four times the visits of the median site.